Never ignore the downtrodden, we noted in late March 2017.
At the time, we were talking about solar stocks, many of which had been left for dead, ignored at historic lows. Many became ridiculously oversold on a perfect storm of lower gas prices, concerns the government would phase out subsidies, as well as crushing amounts of debt.
While the fundamentals told a story of despair, technical analysis painted a completely different story, highlighting just how oversold related stocks became.
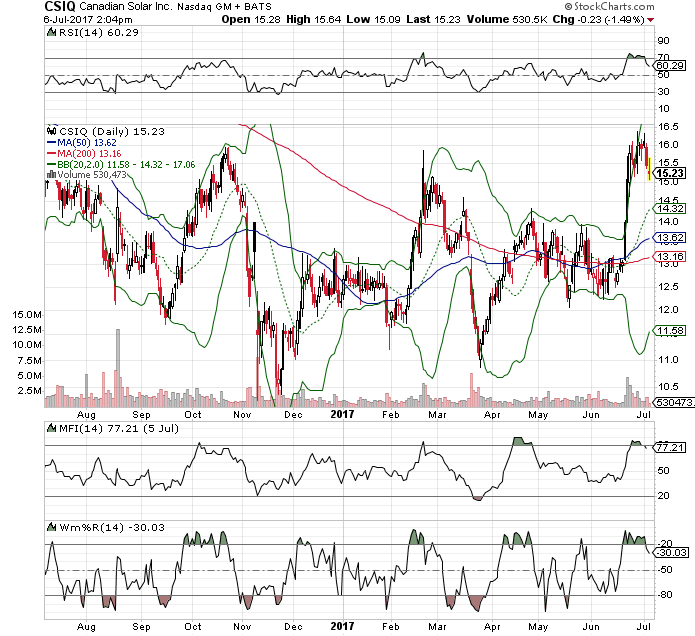
On March 28, 2017, we brought your attention to oversold shares of Canadian Solar (CSIQ). On that day, not only was it stuck at its lower Bollinger Band, relative strength (RSI) was at its 30-line. Williams’ %R was under its 80-line. Not long after Money Flow (MFI) fell under its 20-line.

All confirmed just how oversold CSIQ had become.
The same exact technical pivot points we’ve spoken about aligned at $10.86 – the very bottom of CSIQ at the time. Since then, the stock exploded to a high of $16.50.
A revolutionary fuel source is poised to decimate Big Oil’s obscene profits, make OPEC obsolete, and hand the United States 100% energy independence for the first time in 40 years.
Had you just relied on fundamental analysis, you may have never bought in, proving that technical analysis – when used properly – is a moneymaker.
On that same day, we highlighted an opportunity in the Guggenheim Solar ETF (TAN). At the time, RSI became oversold. Money Flow was at its 20-line. Williams’ %R was under its 80-line. Eventually, the stock would run from $17 to $20.

Those pivot points aren’t just good for calling bottoms, though.
Look at what began to happen in early July 2017 to shares of CSIQ. For the third time since October 2016, relative strength was at its 70-line. Money Flow became overbought above its 80-line. Williams’ %R was above its 20-line.
Again, all confirmed CSIQ was then overbought.
Meanwhile, if we were only relying on fundamental analysis, we would have missed that, too. Instead, simply by paying attention to the psychology of the market with technical analysis, we can call tops and bottoms of stocks, indexes and ETFs.
If you’re not already relying on indicators just like these, try it.
You have nothing to lose… and a lot of potential money to gain.
Make no mistake about it, Solar is on the move, but the key is to focus on the right players in the market. Click Here to get a detailed report on solar technology.
